Issue Dashboard Introduction
This section covers:
🤔 What is Issue Dashboard in TreeAMS?
The Issue Dashboard in TreeAMS provides a centralized and visual overview of all issues across your network. It helps users quickly identify unresolved issues, understand issue urgency, and monitor issue trends without manually filtering long issue lists.
The dashboard focuses on:
- Tracking unresolved issues by severity and urgency
- Highlighting issues that require immediate attention
- Giving visibility across outlets, teams, and issue types
- This allows managers and operators to quickly understand where problems exist and take timely corrective actions.
Here is how to Access the Issue Dashboard:
- Go to Desk. Learn how you can switch to Desk here!
- Click Issues on the left panel menu
- Wait a moment for the Issue Dashboard to load
🔍 How to Read the Issue Dashboard
The Issue Dashboard consists of 6 main sections, read from top to bottom:
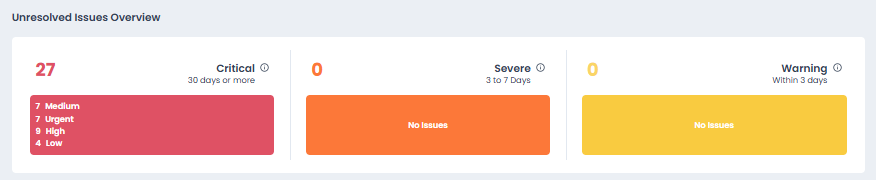
1️⃣ Unresolved Issues Overview (Score Cards)
This is the first section at the top of the dashboard. It summarizes unresolved issues based on how long they have remained open.
 Status Categories:
- 🔴 Critical — Issues unresolved for 30 days or more
- 🟠 Severe — Issues unresolved for 3 to 7 days
- 🟡 Warning — Issues unresolved for within 3 days
Each score card shows:
- The total number of unresolved issues
- A breakdown by issue priority (High, Medium, Low, etc.)
💡 Interactive Filtering
All Score Card are clickable. When you click a status (e.g., Critical), the issue list below will automatically filter to show only outlet with that specific issue status.
This makes it easy to focus on items that need immediate attention.
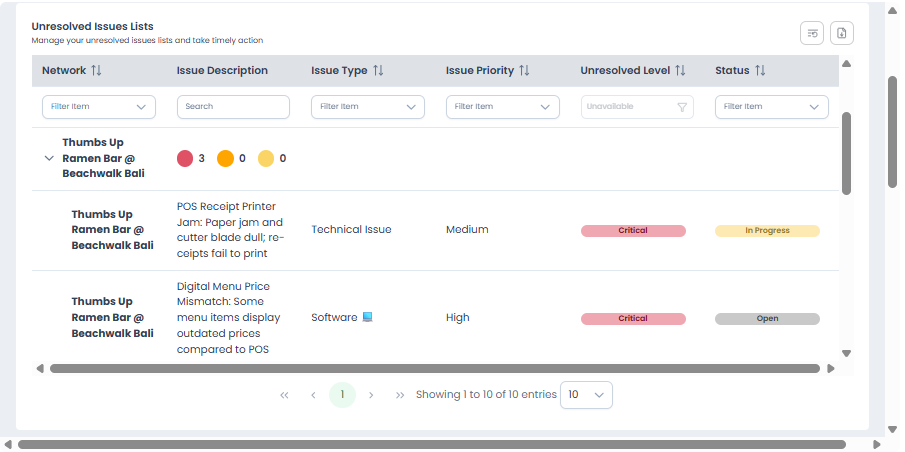
2️⃣ Unresolved Issues List (Table View)
Below the score cards is a detailed table showing all unresolved issues.
 This table will appear when you:
- Check the “See Unresolved Issues Lists” checkbox, or
- Click on one of the score cards to view issues for a specific status.
What the Table Shows:
- Network — The outlet or location where the issue was raised
- Issue Description — A short description of the problem
- Issue Type — The category of the issue
- Issue Priority — The severity level of the issue
- Unresolved Level — How long the issue has remained unresolved
- Status — The current issue status
From this section, you can:
- Use column filters to narrow down the issue list.
- Expand a network row to view issue details, including type, priority, and status.
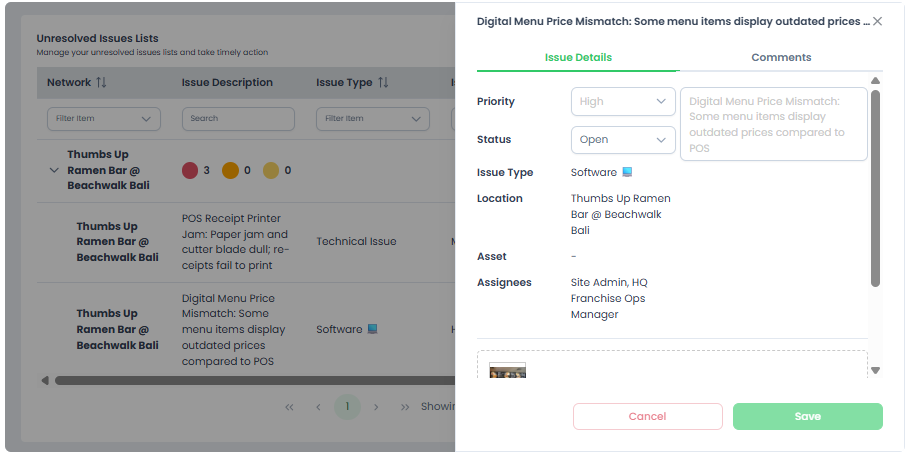
- Click an issue title to open its details in a right-side panel.
3️⃣ Issue Trends (Analytics Section)
Located below the issue list table, the Issue Trends section provides insights into issue patterns and resolution performance over time.
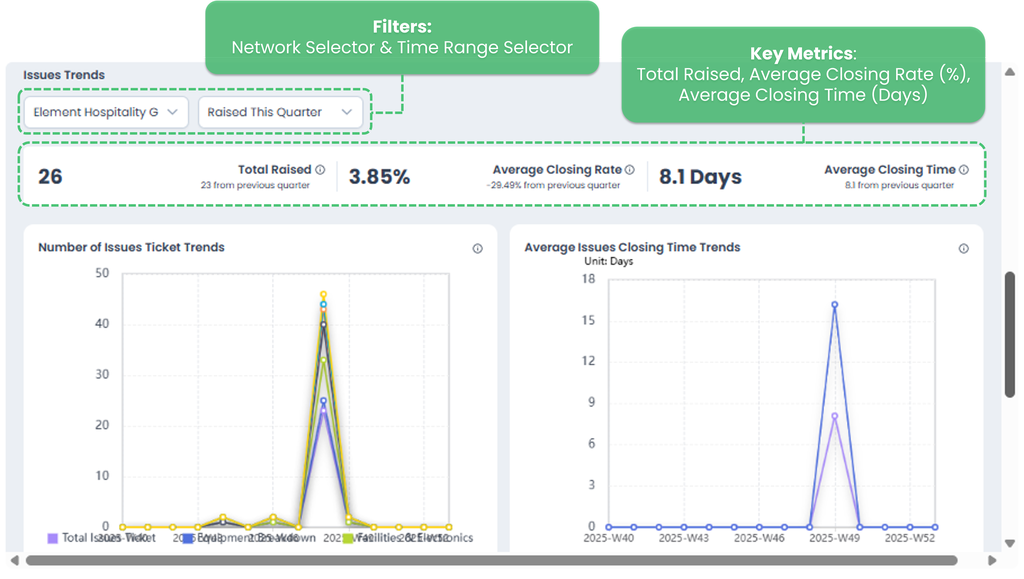 Filters
- Network Selector — Choose which network or outlet to analyze
- Time Range Selector — Select the reporting period (e.g., Raised This Month)
These filters apply to all metrics and charts in this section.
Key Metrics
- Total Raised — Total number of issues raised during the selected period
- Average Closing Rate (%) — Percentage of issues successfully closed
- Average Closing Time (Days) — Average time taken to close issues
Issue Ticket Trends Chart
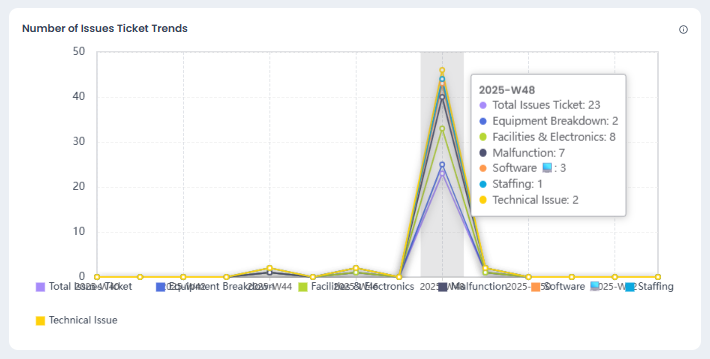 This chart shows how many issues were raised over time.
- The X-axis represents the date or time period.
- The Y-axis represents the number of issue tickets raised.
The Y-axis scale is automatically adjusted by the system for visual clarity. This means the maximum value shown on the axis (e.g., 50) may be higher than the actual number of issues raised. Always refer to the tooltip for the exact count.
Use this chart to:
- Identify spikes in issue occurrences
- Detect recurring operational problems
- Monitor improvements or declines in issue management
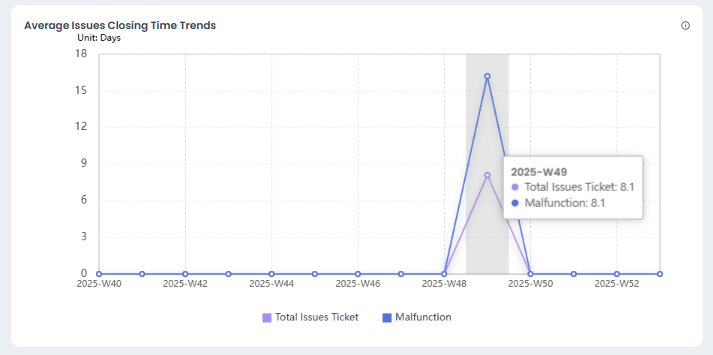
4️⃣ Average Issues Closing Time Trends
This chart shows the average time (in days) taken to close issues over a selected period.
 How to Read the Chart
- The X-axis represents the time period.
- The Y-axis represents the average number of days required to close issues.
- Each line shows the average closing time by:
- Total Issues Ticket (overall average)
- Issue Type (e.g., Malfunction, Technical Issue)
A spike indicates that issues raised during that period took longer than usual to be resolved, while a flat or low line indicates faster resolution.
This helps you:
- Identify periods with slower issue resolution
- Compare closing performance across issue types
- Evaluate whether corrective actions are improving response time
ℹ️ Note: If no issues are closed during a period, the value will remain at zero.
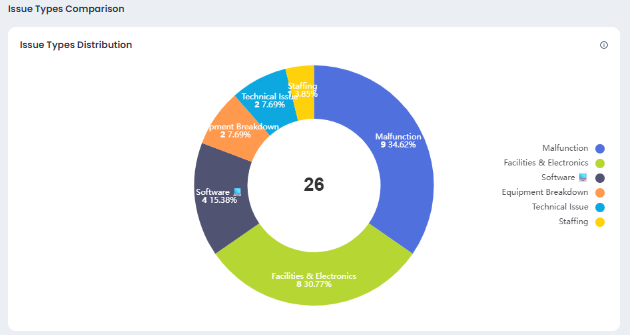
5️⃣ Issue Types Distribution
This chart shows the distribution of issues by type within the selected network and time range.
 How to Read This Chart
- The donut segments represent different issue types (e.g., Malfunction, Facilities & Electronics, Software).
- The percentage on each segment shows how much each issue type contributes to the total.
- The number in the center indicates the total number of issues recorded.
- The legend below helps you identify each issue type by color.
This helps you:
- Identify the most common issue types
- Spot dominant problem areas (e.g., recurring malfunctions)
- Prioritize improvements based on issue frequency
ℹ️ Tip: Larger segments indicate issue types that occur more frequently and may require deeper investigation or preventive action.
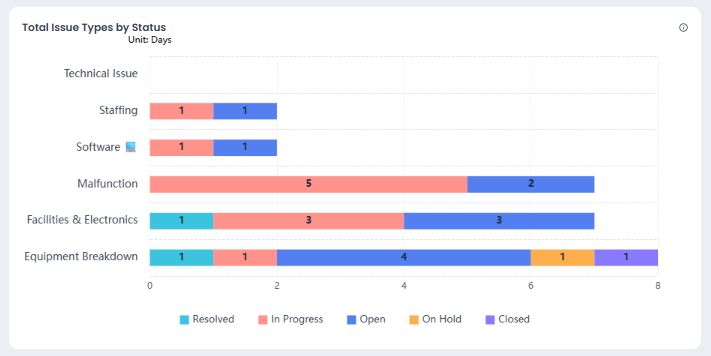
6️⃣ Total Issue Types by Status
This chart shows how long issues spend in each status, broken down by issue type.
 How to Read This Chart
- Each row represents an issue type (e.g., Malfunction, Software, Equipment Breakdown).
- The colored bars represent issue statuses: Resolved, In Progress, Open, On Hold, Closed.
- The numbers indicate the duration in days spent in each status.
💡 Use this chart to identify bottlenecks by issue type and prioritize issues that remain unresolved the longest.
This helps you:
- Understand how issues are progressing across different categories
- Identify issue types with many open or in-progress cases
- Monitor resolution progress at a glance
ℹ️ Tip: Use the tooltip to see the exact number of days an issue spent in each status by hovering over a bar segment.