Navigate TreeAMS Insights
This section covers:
How to Navigate TreeAMS Insights
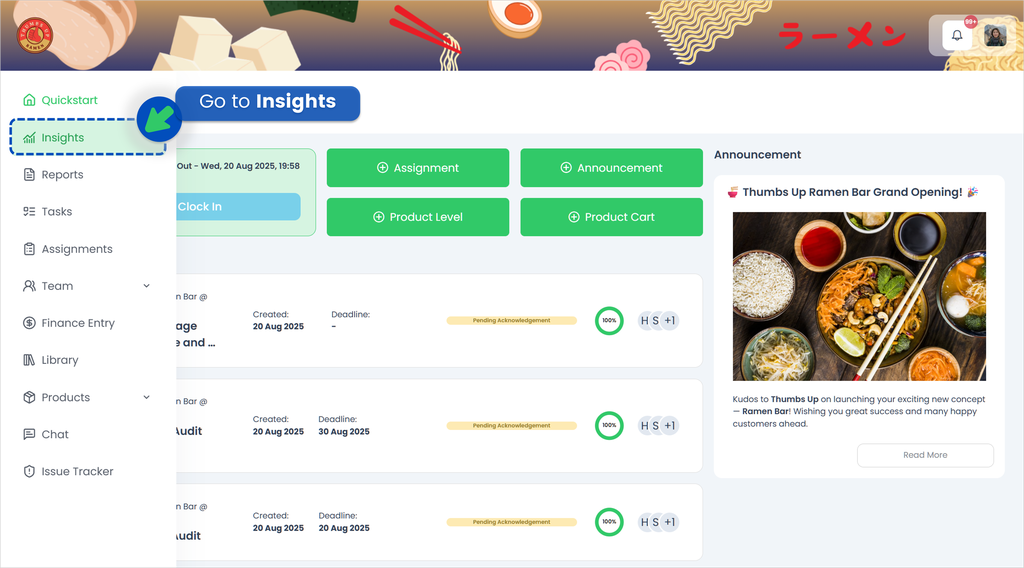
- Login to your TreeAMS account
- Hover over the left menu panel and go to Insights.
- Let’s explore the different functions available in TreeAMS Insights.
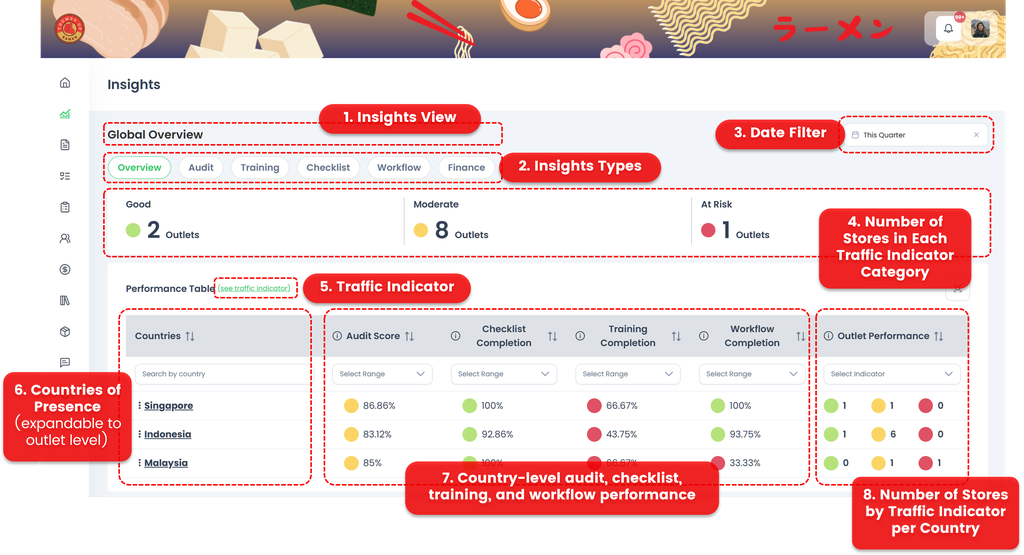
* Clickable/expandable- Insights View 👉 The main dashboard that provides an overview of business performance.
- Insights Types* 👉 Different categories of insights available, such as Overview, Audit, Training, Checklist, Workflow, and Finance.
- Date Filter* 👉 A filter that lets you view insights by time period (e.g., this month, this quarter, this year).
- Number of Stores in Each Traffic Indicator Category 👉 Shows how many stores fall into Green, Amber, or Red based on set thresholds.
- Traffic Indicator* 👉 The threshold settings that determine whether a store or outlet is classified as Green, Amber, or Red. Please refer to How to Set Up Traffic Indicator for more information on setting different weightages for different modules. These weightages determine when the store is shown as green, amber, or red.
- Countries of Presence* 👉 Displays the countries where your business operates, with the option to drill down to outlet level.
- Country-level audit, checklist, training, and workflow performance 👉 Summarises operational performance across different modules for each country.
- Number of Stores by Traffic Indicator per Country 👉 Breaks down store counts by traffic indicator (Green/Amber/Red) for each country.
How to Set Up Traffic Indicator 🚥
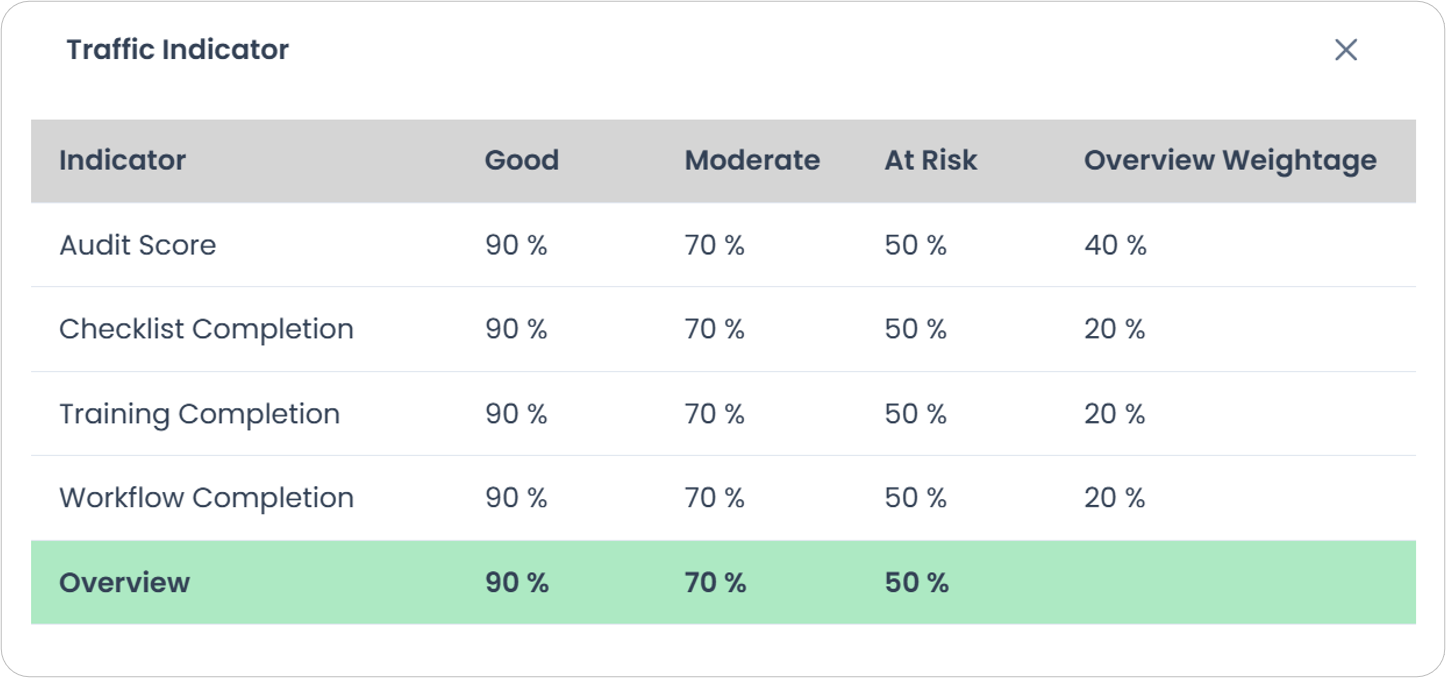
In TreeAMS, you can define what counts as good, moderate, or at risk. The default thresholds are shown in the image below. You can't adjust the weightage by yourself but you can request your consultant to adjust it if needed.
Here's how you can interpret these indicators:
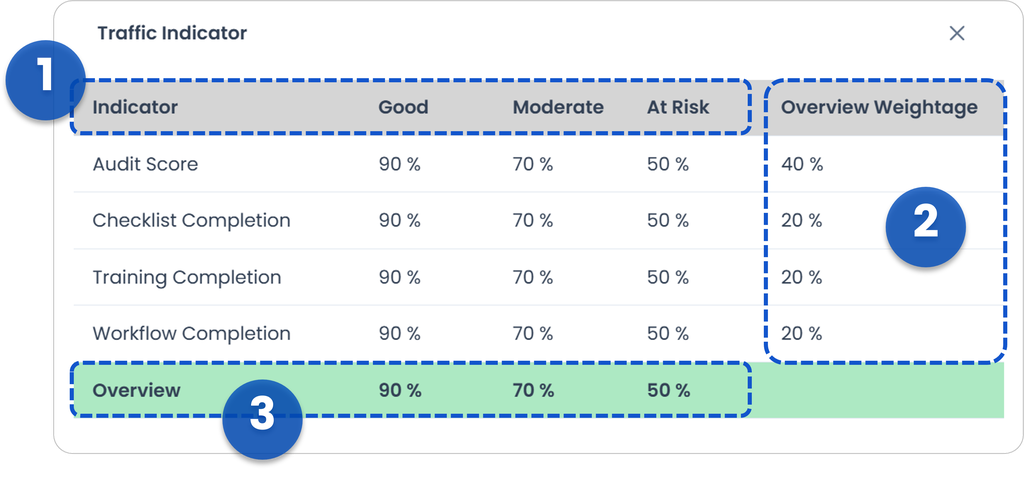
- Indicator
The indicator shows the percentage that determines whether an outlet is Green (Good), Amber (Moderate), or Red (At Risk). You can set different percentage thresholds for each module—Audit, Checklist, Training, and Workflow.
Example: If the average audit score is 85%, the outlet will fall under Amber (Moderate). - Overview Weightage
This represents how much importance you place on each module.
Example: In the image, the user assigns 40% weight to Audit, giving it more influence compared to the other modules. - Overview
This is the final color (Green, Amber, or Red) that reflects the overall performance of the outlet, based on the combined results and weightage of all modules.
Brand Filter on Desk vs Portal
Task Insights could applies brand selection differently between Desk and Portal to ensure dashboards display data from the correct brand.
- On Desk, a global Brand dropdown is available. Users can switch brands manually, and the dashboard will update based on the selected brand.
- On Portal, there is no brand filter. The system automatically uses the brand shown in the Portal Header, and Insights data will follow that brand context.
Default Brand Logic
- If a user has multiple brands, the system will automatically use the default brand.
- If the user has only one brand, that brand will always be applied.
Troubleshooting Tips
When Insights data looks incorrect, first confirm:When to Escalate
- Are you accessing from Desk or Portal?
- Which brand is currently selected?
- For Portal:
Check the Portal Header to confirm the active brand.- For Desk:
Try switching to the correct brand using the dropdown, then refresh the page.
Escalate if:
- Changing the brand on Desk does not affect the data
- Portal shows data from the wrong brand
- The user has correct access but the brand is not applied
If you need assistance, please email us at
connect@treeams.com.
We are happy to help! 👋😊